Consumables in Nigerian homes would scarcely be complete without counting an item or two from Unilever Nigeria Plc. and Nestle Nigeria Plc. Although both are classified under the consumer goods sector, Unilever Nigeria is particularly streamlined towards personal and household products while Nestle Nigeria is into the diversified food products segments.
An analysis of the financial performance of both publicly listed companies for the first quarter of 2018 brings to fore interesting details.
Constrained by foreign exchange scarcity and depleting disposable income of the average consumer, these companies have and still seek diverse tactics to sustain business operations.
Indeed most consumer goods companies, including Unilever and Nestle, spent a great deal of their time last year trying to consolidate their businesses through ramping up capacity and focusing on stimulating demand.
Whether these strategies are beginning to yield fruits or take them a bit further back than they had anticipated is the main focus of in this analysis of both companies financial report obtained from the Nigerian Stock Exchange (NSE).
Revenue Growth:
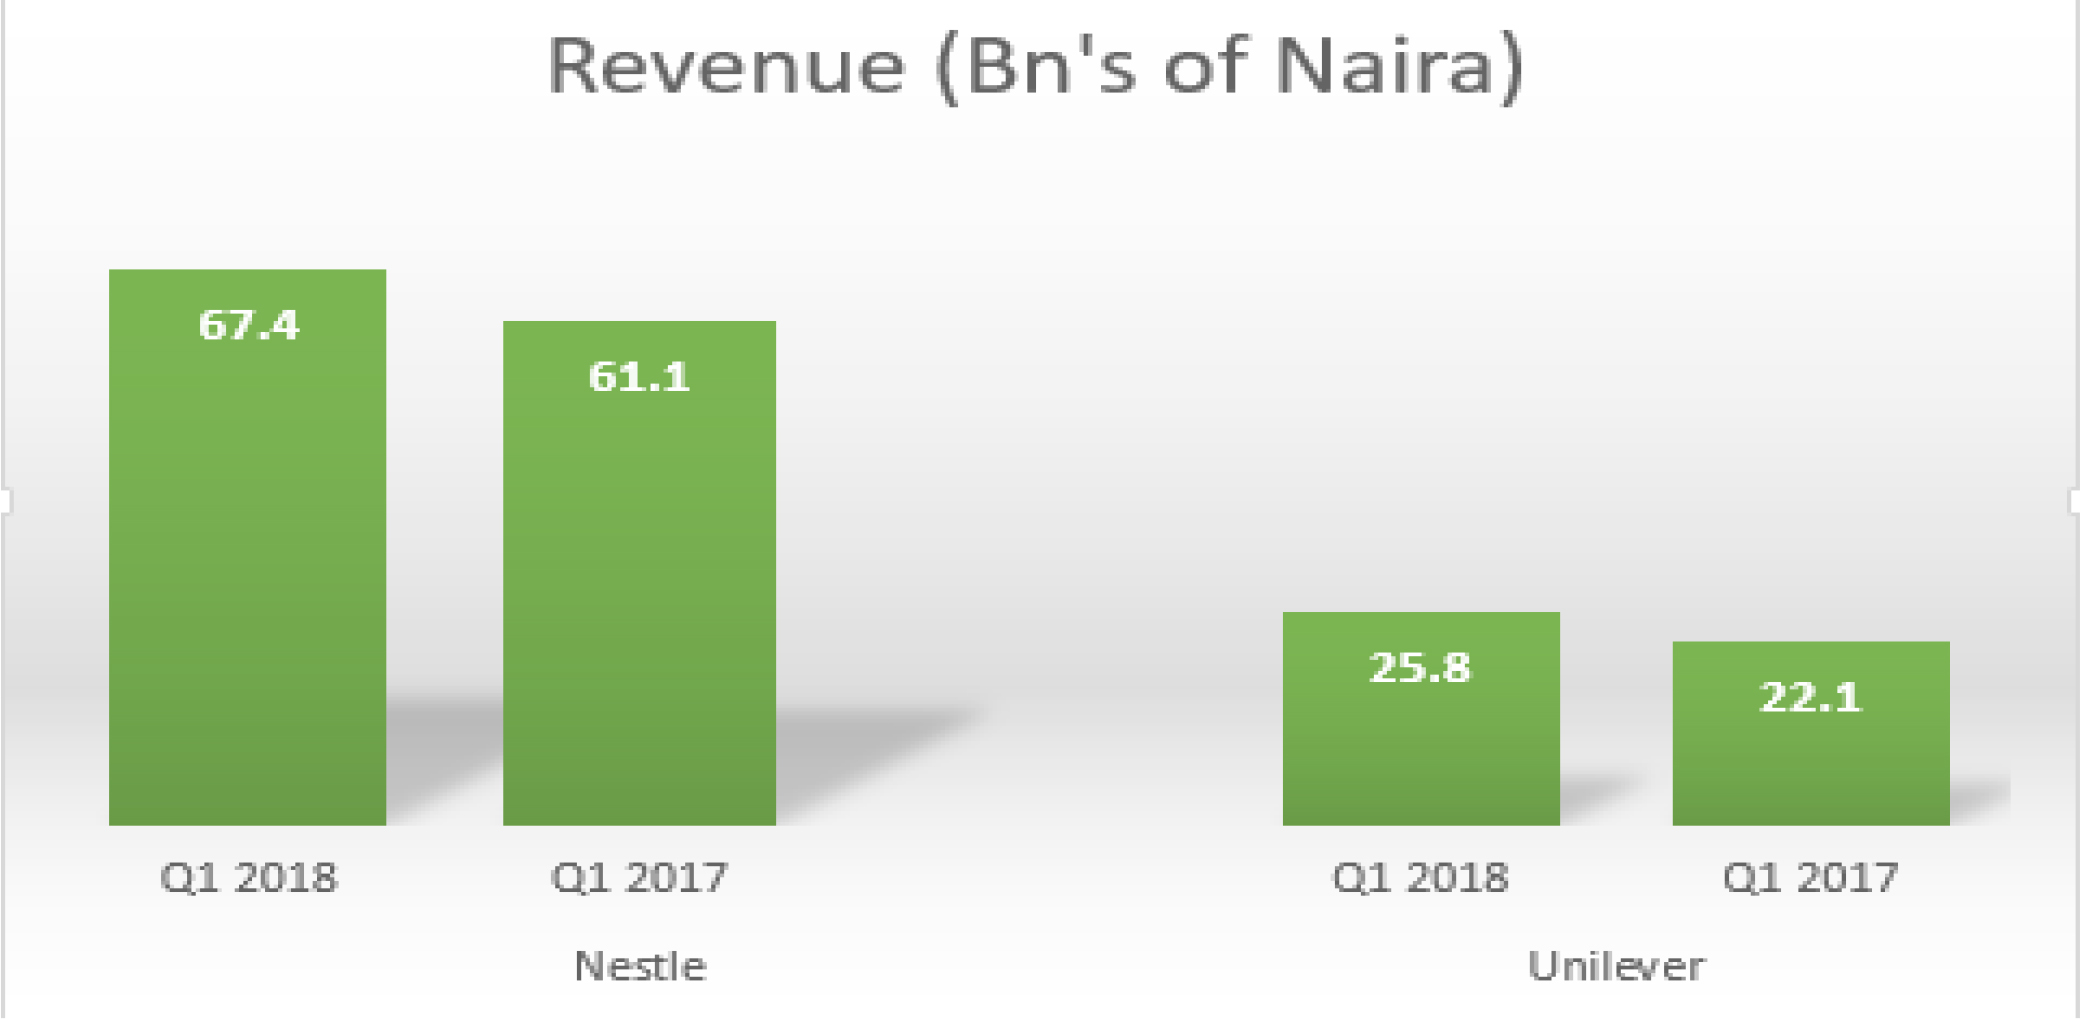
Following price increases in its products up till Q2 2017, Unilever Nigeria Plc. recorded a 16 percent increase in revenue in Q1 2018. Also impacting revenue were significant increases in volume sold, resulting from campaigns and promotional activities in the quarter under review (for Knorr Chicken seasoning and Close-Up toothpaste); increased activities of distributors following the slack in Q4-17; and the introduction of new products, notably (from our routine checks), Sunlight bar soap and 70g and 25g Sunlight detergents.
For Nestle, a 10 percent increase in revenue stemmed from a volume-price mix. Stanbic Stockbrokers in a retail price survey discovered that beverages segment of the company grows faster than food. The survey showed relatively muted prices for Nestlé’s products since the last significant price increase in Q1-17. Interestingly, the beverages segment grew at a faster pace of 17 percent y/y despite relatively flat prices compared to 7 percent for the food segment, which saw a price increase of about 5 percent. This could be indicative of a stronger competition for Nestlé’s food products- Maggi and Golden Morn.
Profits:
Unilever Nigeria’s profit performance for the quarter ended 31st March 2018, in comparison with the same period of 2017, showed net profit increased from N2.1billion to N3.9 billion. Gross profit also increased by about N900 million to N7.1 billion from N6.2 billion in 2017. Meanwhile, Nestle Nigeria’s performance for the same period under review shows a net profit decline from N14.2 billion to N13.6 billion despite a gross profit increase of about N2 billion to N25.7 billion from N23.4 billion in 2017.
An analysis of both firms’ performance with a number of key market ratios often used by investors to assess the overall well-being of a company relative to itself in previous periods, and also relative to its peers, indicates both firms are struggling to make requisite returns.
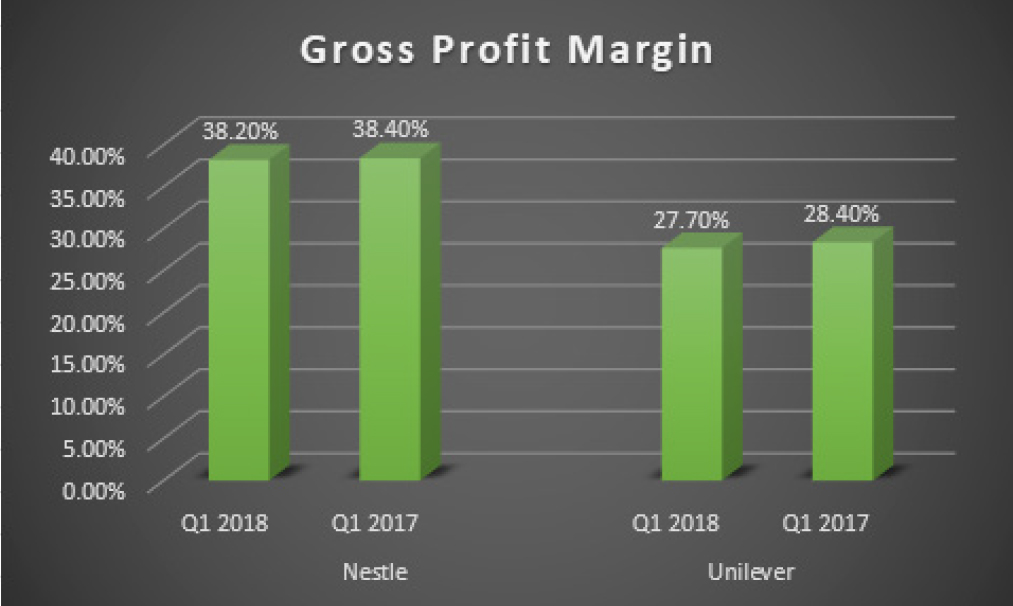
Unilever gross profit margin (GPM) fell by 2.5 percent from the 28.4 percent recorded in 2017 to 27.7 percent in 2018 for Unilever as a result of 16 percent increase in the cost of sales.
For Nestle, GPM fell 0.5 percent from the 38.4 percent in 2017 to 38.2 percent this year. Also indicative of a higher cost of sales, pressured by the rising price of petroleum products within the review period, which form key inputs in both company’s production process. Also slowing down margins for Nestle was an impairment loss of N3.4 billion recorded in the food segment.
Net profit margin (NPM), an indication of profitability from current operations, without regard to operating cost for the period, was calculated at 15.2 percent, showing a 55 percent year-on-year increase from the figure recorded in Q1-2017. This is indicative of the well-executed cost control put in place by the company as finance and marketing expenses dropped while finance income increased.
Nestle NPM for Q1-2018 was calculated as 20.2 percent, which is still fair but considering Q1-2017 performance it decreased by 13.6 percent. This means warning signals of a reduction in finance income and an increase in marketing and distribution expenses of the company.

Balance Sheet:
Financing structure for Unilever in the period under review dropped as the calculated current ratio, which shows the ratio to which the current assets of the company can cater for the current liability was 2.2 times compared to 2.5 times of the corresponding period in 2017. Looking in more detail at the composition of the return on capital employed, which measures the proper utilization of the company’s capital to generate profit, the reason for Unilever’s improved profitability is due to increased efficiency in the use of the company’s assets (net asset turnover), which increased by 13 percent.
Meanwhile, from the closing inventory-holding period, it shows that Unilever Nigeria would take about 279 days an increment from 264 days of 2017, indicating a less efficient inventory holding as Unilever will take 279 days to sell off its stock.
An analysis of Nestle financing structure improved in the period under review as its calculated current ratio was 1.1 times, a poor but welcome increase compared to 1.0 time in the corresponding period in 2017.
The composition of the return on capital employed which revealed yet another reason for the reduced profitability, as seen in the decreased efficiency in the use of the company’s assets (asset turnover), depreciating from 1.4 to 1.3 times (a reduction of -7%).
Meanwhile, from the closing inventory-holding period perspective, Nestle Nigeria would take about 257 days to sell its stocks, an increment from 232 days previously, indicating a less efficient inventory holding for the company.
Investor’s sentiments towards the stocks of the two companies are indicative of their respective year-to-date returns. Nestle has returned just above 1 percent with a share price on N1,573 per share, while Unilever’s share price as at close of trade on Friday 18th May 2018, settled at N50 with a year to date return of 22 percent.
Analysis by Adesola Afolabi, and Oluwaseun Afolabi


