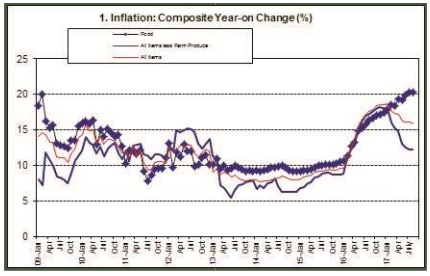
Nigeria’s consumer price index (CPI), which measures inflation or the average change over time in prices of goods and services consumed by people for day-to-day living, increased by 16.01 percent year-on-year in August 2017, representing a 0.04 percent slowdown than the rate recorded in July (16.05%).
The August inflation figures as released by Nigeria’s statistical agency, the National Bureau of Statistics (NBS), indicate a seventh consecutive decline in the rate of headline inflation year-on-year since January 2017.
The deceleration in the pace of inflation, according to analysts is as a result of waning base effect of hike in petroleum products prices in 2016, which sporadically shot up consumer product prices across the country in the entire year.
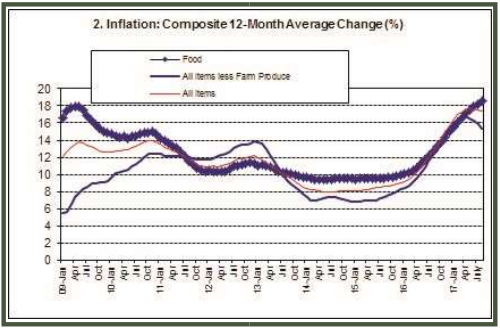
According to data from the NBS, the percentage change in the average composite CPI for the twelve-month period ending in August 2017 over the average of the CPI for the previous twelve-month period was 17.33 percent, 0.14 percent point lower from 17.47 percent recorded in July 2017.
The NBS noted that increases were recorded in all the divisions of the classification of individual consumption by purpose (COICOP) that yielded the headline index.
COICOP is a classification used to classify both individual consumption expenditure and actual individual consumption.
On a month-on-month basis, the headline index increased by 0.97 percent in August 2017, 0.24 percent points lower from the rate of 1.21 percent recorded in July.
The data showed that the urban index rose by 16.13 percent (year-on-year) in August 2017, down by 0.09 percent point from 16.04 percent recorded in July, while the rural index increased by 15.91 percent in August from 16.08 percent in July.
On month-on-month basis, the urban index rose by 0.99 percent in August 2017, down by 0.26 percent point from 1.25 percent recorded in July, while the rural index rose by 0.95 percent in August 2017, down by 0.23 percent point from 1.18 percent in July.
The corresponding twelve-month year-on-year average percentage change for the urban index increased from 18.43 percent in July to 18.15 percent in August, while the corresponding rural index also increased from 16.60 percent in July to 16.58 percent in August
Food price pressure continued into August as all major food sub-indexes increased. The food index increased by 20.25 percent (year-on-year) in July, down marginally by 0.03 percent points from the rate recorded in July (20.28 percent).
The rise in the index was caused by increases in prices of bread and cereals, meat, fish, oils and fats, milk cheese and eggs, coffee, tea and cocoa.
On a month-on-month basis, the Food sub-index increased by 1.14 percent in August, down by 0.38 percent points from 1.52 percent recorded in July.
The average annual rate of change of the food sub-index for the twelve-month period ending in August 2017 over the previous twelve month average was 18.57 percent, 0.32 percent points from the average annual rate of change recorded in June (18.25) percent.
Core CPI, which excludes food and volatile agricultural produce, eased by 0.10 percent during the month of August to 12.30 percent points from 12.20 percent recorded in July as all key divisions, which contributes to the index increased.
On a month-on-month basis, the core sub-index increased by 0.93 percent in August, 0.07 percent points lower from 1.00 percent recorded in July.
The highest price increases were recorded in clothing materials and articles of clothing, garments, passenger transport by air, motorcycles, shoes and other footwear, furniture and furnishing, books and stationery, non-durable household goods, pharmaceutical products and maintenance, repair of personal transport equipment and glassware, tableware & household utensils.
The average 12-month annual rate of rise of the index was recorded at 15.37 percent for the twelve-month period ending in August 2017, 0.43 percent points lower from the twelve-month rate of change recorded in July


